Viewing Tracing Logs
After you enable CTS, the system starts recording operations on DBSS. Operation records for the last seven days can be viewed on the CTS console.
Viewing a DBSS Trace on the CTS Console
- Log in to the management console.
- In the navigation pane on the left, click
 and choose . The CTS console is displayed.
 - Choose Trace List in the navigation pane.
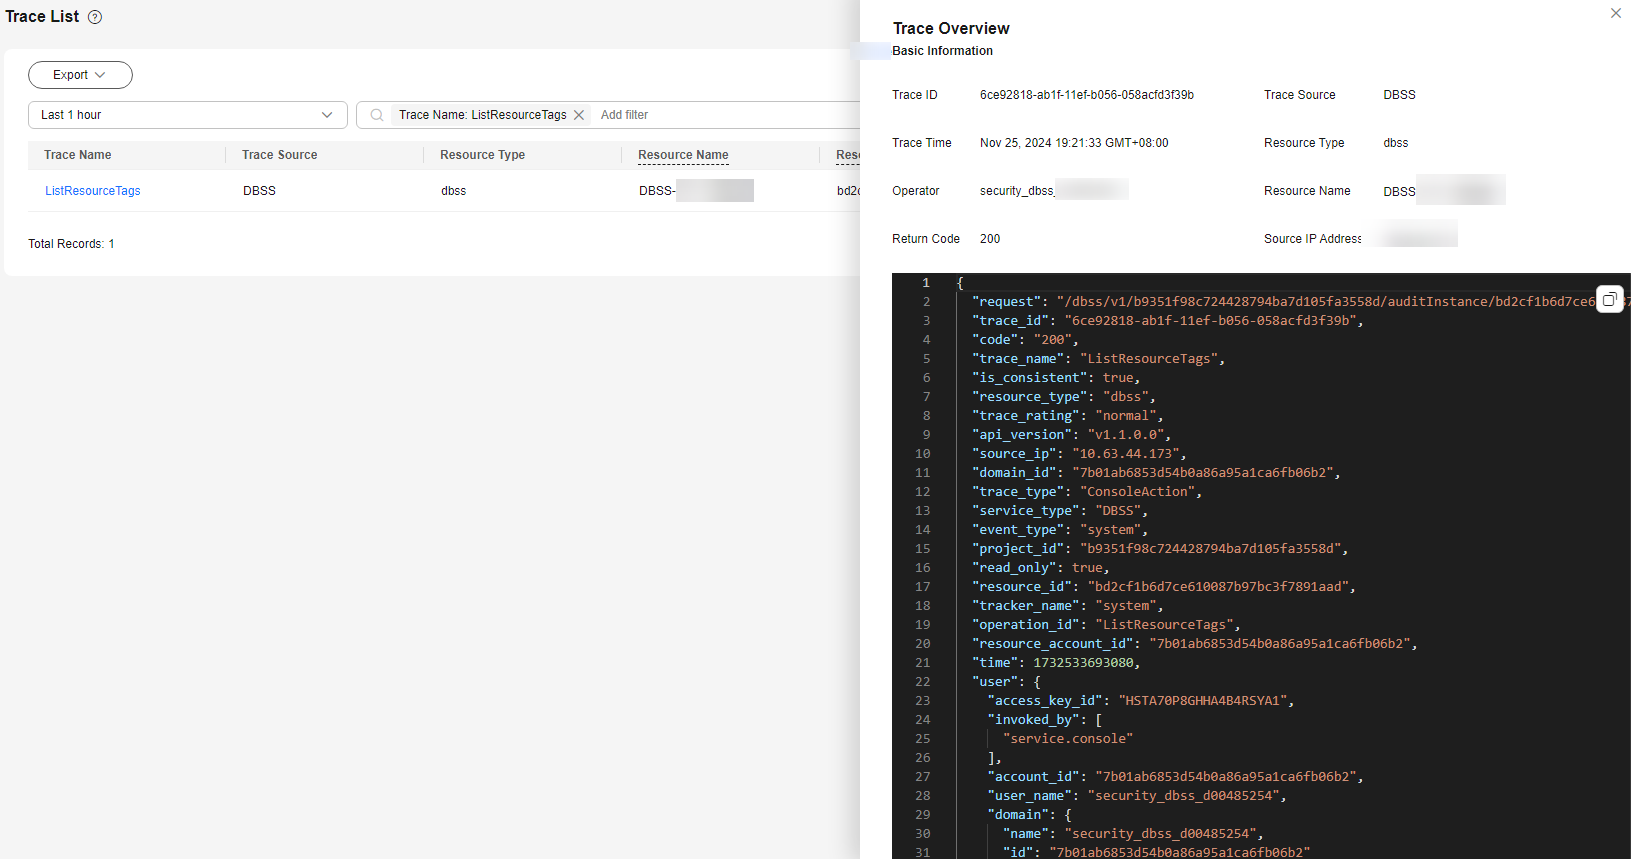
- You can select Last 1 hour, Last 1 day, Last 1 week, or customize a time range above the list to view the events generated in the selected time range. You can also select an attribute from the search box above the list or enter a keyword to search for specified events.
Figure 1 Trace list

- Click the name of an event to view its details.
Figure 2 Viewing traces

Feedback
Was this page helpful?
Provide feedbackThank you very much for your feedback. We will continue working to improve the documentation.


