
Updated on 2025-04-29 GMT+08:00
Viewing Monitoring Metrics
You can view DBSS metrics on the management console to learn about the database security status in a timely manner and configure protection policies based on the metrics.
Prerequisites
DBSS alarm rules have been configured in Cloud Eye. For more details, see Configuring Alarm Monitoring Rules.
Procedures
- Log in to the management console.
- Click
 in the upper left corner of the page and choose Management & Governance > Cloud Eye.
 - In the navigation pane on the left, choose Cloud Service Monitoring.
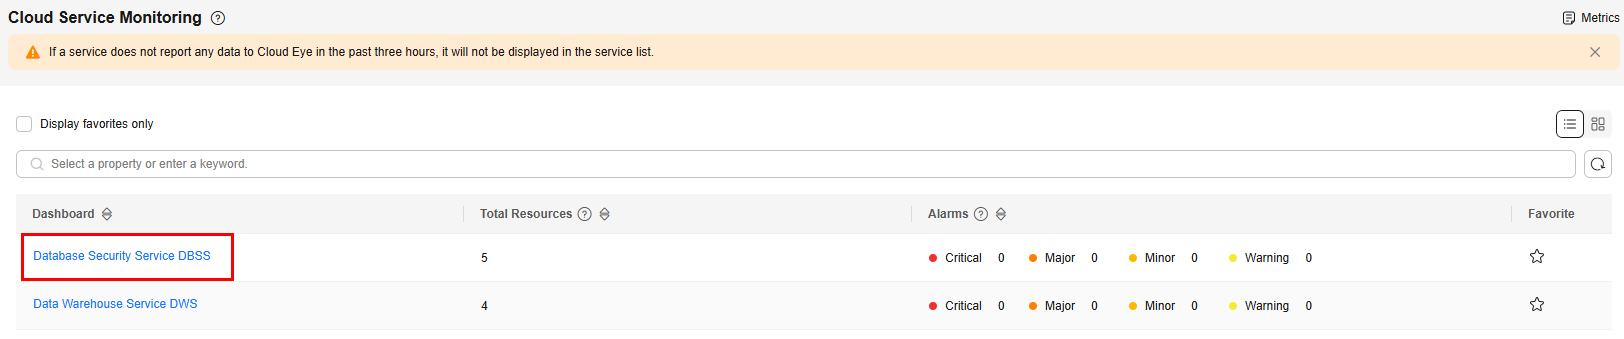
- Click the dashboard name Database Security Service DBSS. Figure 1 Cloud service monitoring
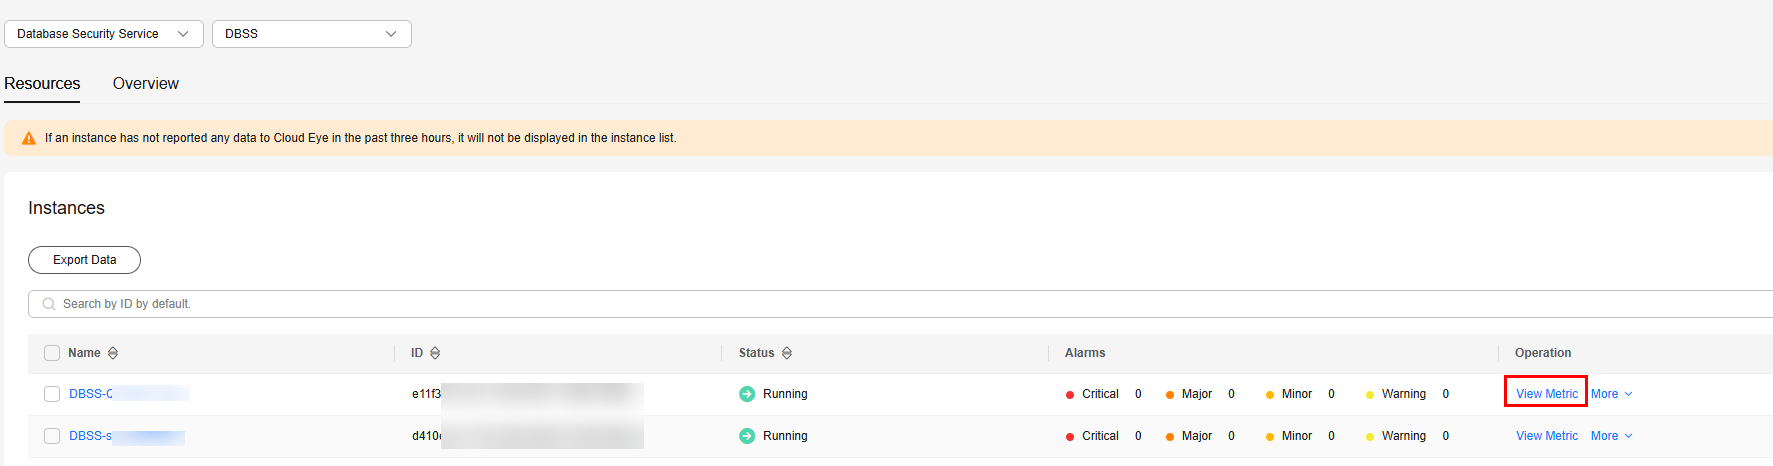
- In the row containing the dedicated DBSS instance, click View Metric in the Operation column. Figure 2 Viewing monitoring metrics
Parent topic: Monitoring
Feedback
Was this page helpful?
Provide feedbackThank you very much for your feedback. We will continue working to improve the documentation.
The system is busy. Please try again later.


