

Overview
Choose Monitoring > Overview. On the Overview page, you can view the statistics of job instances in charts. Currently, you can view seven types of statistics:
- Status
- You can filter out your or all job instances by selecting My Instances or All, and filter out job instances of the current day by selecting Today.
- You can filter out your or all job instances by selecting My Instances or All, and filter out job instances of the current day by selecting Yesterday.
- You can filter out your or all job instances by selecting My Instances or All, and filter out job instances of the current day by selecting Two days ago.
- You can filter out your or all job instances by selecting My Instances or All, and filter out job instances of the current day by selecting Last 7 days.
- You can click a status to go to the Monitor Instance page and view details about all jobs in the status.

- The statistics include the monitoring data of the instances of real-time jobs. When you click a status, you will not be redirected to the Monitor Instance page of real-time jobs. Instead, you can only view the details of the instances of batch jobs.
- By default, the system displays all job instances of the current day.
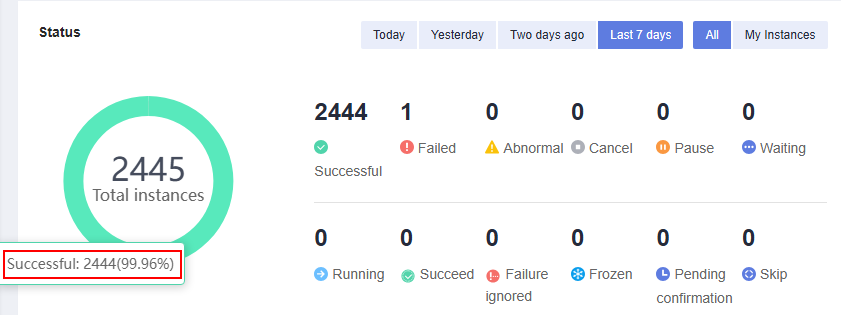
- You can view the total number of instances that meet the filter criteria, the total number of instances that were successfully executed, and the percentage of such instances. Figure 1 Status
- Completed Tasks
Successfully executed instances of the current day are collected once an hour. A task is a job node.
- You can specify a date and view the number of all job nodes successfully executed on the previous day, on the selected day, and over the last seven days on average.
- You can specify a date and view the number of different types of job nodes successfully executed on the previous day, on the selected day, and over the last seven days on average.
- Tasks
Number of tasks (operators in jobs) started in five minutes. Data of 30 days is available.
- You can filter the operators started on each day within 30 days.
- You can view the curve of the number of all operators that have been started.
- You can view the curve of the number of different types of operators that have been started.
- Running DLI Jobs/Queue CU Usage
You can filter the number of running DLI jobs and the CU usage of a specified queue.
- You can view data of the last seven days by default, and view data of one month at most.
- You can only view data of non-default queues. You can click the name of a queue to pin the queue to top.
- Number of Jobs and Number of Tasks Scheduled Daily
This area displays the trend of the total number of jobs in a long period and the number of tasks scheduled each day. A task indicates an operator in a job.
Number of jobs: total number of batch processing jobs and real-time jobs
Number of tasks scheduled daily: number of tasks scheduled everyday, including both real-time and offline tasks. The number is calculated based on the nodes that are successfully scheduled.
- By default, the system displays the number of jobs and the number of tasks scheduled each day in one month. You can filter data by time range.
- Task Type Distribution
You can view the number of job nodes of different types.
A task indicates an operator in a job.
The system collects statistics on the number of nodes in all submitted jobs, including real-time jobs and batch processing jobs.
- Top 100 in Instance Running Time
- You can filter out the top 100 instances of yours or all users with the longest running duration by time and owner.
- You can click a job name to go to the Monitor Instance page and view the job running details.
- By default, the system displays top 100 job instances in one month.
- Top 100 in Instance Failed to Run
- You can filter out the top 100 instances of yours or all users with the most failures by time and owner.
- You can click a job name to go to the Monitor Instance page, view the logs of the failed job instances, and analyze the causes.
- By default, the system displays top 100 job instances in one month.
- End of scheduling in the next week
You can view the jobs that are expected to be completed in the following week, including their names, owners, and end time.
- Jobs that are expected to be completed in two days or less are displayed in red.
- Jobs that are expected to be completed in three to five days are displayed in orange.
- Jobs that are expected to be completed in six to seven days are displayed in black.


