What Should I Do If I Cannot Find Common Monitoring Items When Configuring DDS Alarm Rules?
Symptom
When a DDS alarm rule is configured, some common monitoring metrics, such as the CPU usage, memory usage, and storage space usage, are not displayed.
Possible Causes
When you configure alarm rules on the Cloud Eye console, the configured monitoring dimensions are inconsistent with the dimensions supported by the monitoring metric. As a result, the monitoring metrics are not displayed.
For example, if the objects whose CPU usage you want to monitor are dds mongos nodes or primary/standby nodes, the monitoring dimension you configure for an alarm rule on the Cloud Eye console must be at the node-level.
Solution
DDS supports instance-level and node-level metric monitoring. Set dimensions supported by monitoring metrics on the alarm rule page. Different metrics have different dimensions. For details, see Supported DDS Metrics.
For example, the monitored objects of CPU usage can be dds mongos nodes of a DDS cluster instance, or the primary and standby nodes of a DDS DB instance.
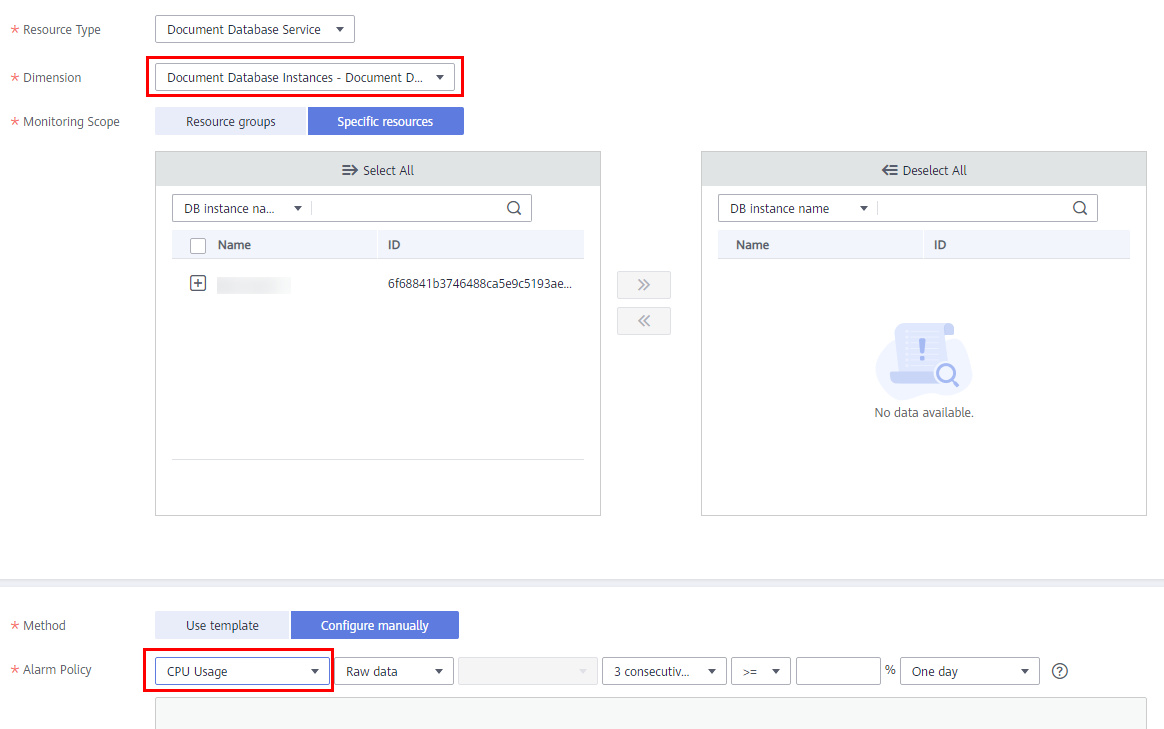
When configuring alarm rules on the Cloud Eye console, select Document Database Instances - Document Database Node for Dimension. Then, you can view the CPU usage in the alarm policy.

Feedback
Was this page helpful?
Provide feedbackThank you very much for your feedback. We will continue working to improve the documentation.


